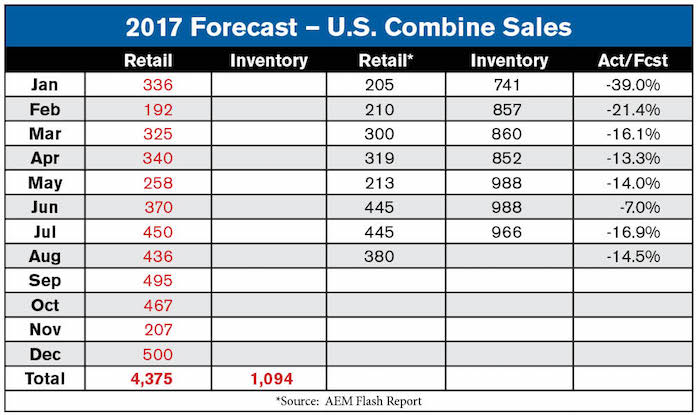
Forecast vs. Actual
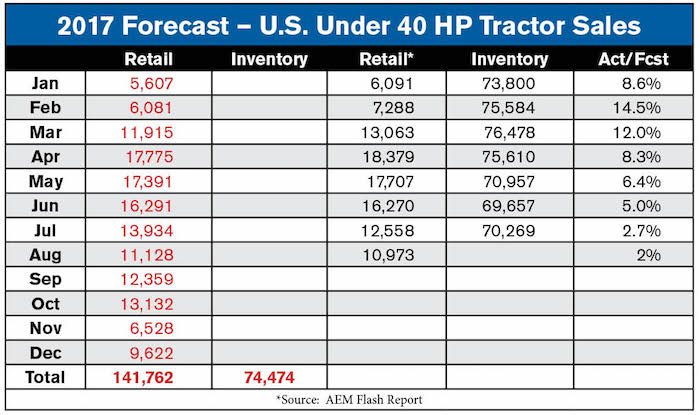
Under 40 Horsepower Tractors — These smaller tractors had another very good month and their performance is indicative of the strength of the general U.S. economy. The actual result through August is 2.2% more than our original forecast for this segment.
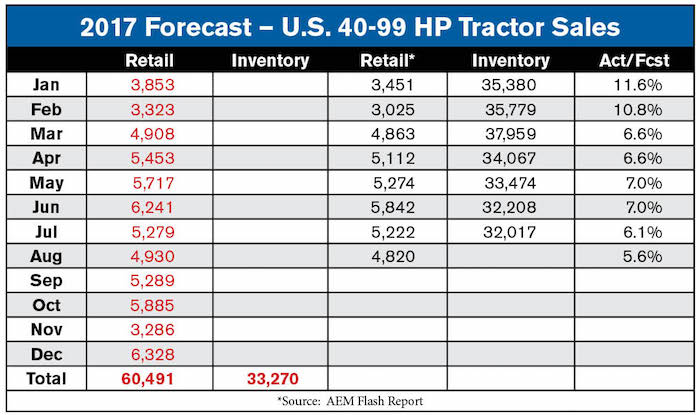
40 – 99 Horsepower Tractors — The lower horsepower range (40 – 60 HP) continues to power this segment and the total retail numbers continue to close in our original forecast. Actual results are 5.6% above our forecasted number.
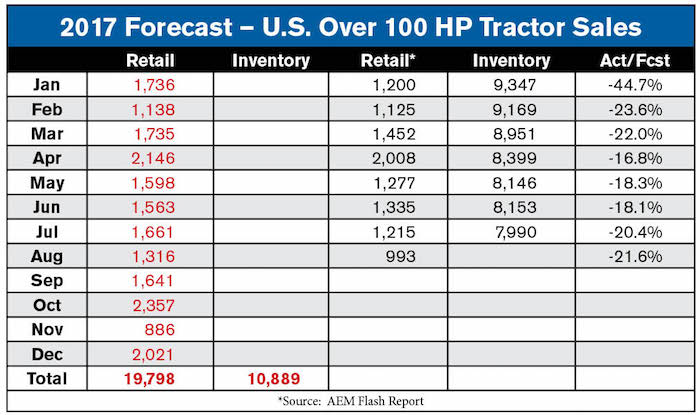
100 + Horsepower Tractors — Weakness in the category continues as the pressure from low commodity prices takes its toll. This category is –21.6% of our original forecast.
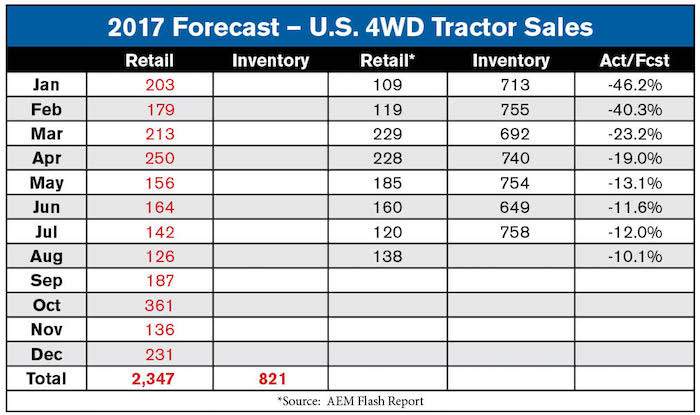
4 WD Tractors — This category is showing a bit of strength and is currently 10.1% below our forecasted volume.
Combines — Sales of combines are a victim of the falling commodity prices and have been consistently below our forecast, but are slowly inching back toward our original projections. This segment stands at –14.5% of forecast.
How strong is our weak agricultural economy?
The strength of our agricultural economy hinges on the value of the Net Farm Income (NFI) each year. In 2002, the NFI bottomed out at $39.1 billion and the very next year shot up to $61 billion and remained fairly strong until its peak in 2013 at $123.8 billion. Since that time it has been on a steady decline with 2016 recording NFI at $68.3 billion and 2017 is projected to be slightly higher than that level, suggesting a bottom in the agricultural economy.
Net Cash Farm Income represents the flow of capital into the bank account of U.S. farmers and ranchers while it also impacts the demand rate for agricultural loans. The factor that most closely relates to demand for capital is the debt/asset ratio for agricultural producers. That factor has risen from 11.4% in 2013 and now is approximately 12.6% according to USDA ERS’ Aug. 30, 2017 Farm Income and Wealth Data report. The total value of farm debt in 2013 was $11.5 billion, not including the operator’s dwelling, and that debt level was virtually unchanged at $11.6 billion on Dec. 31, 2016.
The increase in the debt/asset ratio can be attributed, in part, to the decline in the value of farmland over the past several years. According to USDA ERS’ Farm Sector Indicators, August 2017, the financial assets available to farmers are down 9% from the 2013 level while NFI is down nearly 50% during that same period.
While there are farmers with considerable debt today and there are others who have practically no debt, the average U.S. farmer should be seen as a conservative businessperson. The conservation of financial assets during these difficult years indicates there is some financial strength within the U.S. agricultural economy.
Will this translate to equipment purchases in 2018?
There is, and probably will remain, a base demand for farm equipment each year but the buyers that make it a “good year” are those who are not buying out of necessity. The bonus depreciation tax regulations that began in 2011 have certainly had the effect of pulling equipment purchases ahead and the current push to lease equipment in this down market will have a negative effect upon new equipment sales in the next few years since there will be a large supply of high quality, low hour lease equipment being returned to dealers’ inventory. This used inventory could reduce new equipment purchases in the next few years.
2017 is projected to see a slightly improved Net Farm Income and a small increase in financial assets of U.S. farmers and ranchers and that most likely will produce a slight increase in the new equipment being sold next year. The one area where our models are predicting difficulty is in the 100-plus horsepower tractor category. Both the availability of high quality used tractors and the pressure of low commodity prices will most likely keep this segment much the same as this year.
Commodity Prices
Historically commodity prices tend to find a season low sometime between mid-August and mid-September and this year it appears to be in the late August period. This is the time that many food processors will place their hedge orders for their future needs and that usually has the effect of stabilizing the commodity prices prior to harvest.
Corn — Prices fell rather sharply in August with the September contract closing at $3.42 per bushel while the December contract closed the month at $3.57 and March closed at $3.70. According to the USDA the current corn crop is ranked fourth in terms of “Excellent to Good” for the past 5 years.
Soybeans — Prices also fell sharply for this commodity in August with the September contract closing at $9.36, the November contract at $9.45 and the January contract at $9.55. The soybean crop is tracking the corn crop in terms of condition and USDA’s report ranks 2017 at fourth out of the last 5 years.
Conclusion
Farm equipment sales history is replete with hills and valleys and we certainly are in a valley now. Traditionally, the range between the hilltop and the valley floor is about 20% in terms of unit sales. This valley has exceeded that range slightly in the larger horsepower tractors and in combines, but there is increasing evidence that the next hill is right around the corner. How steep that hill might be is dependent upon many factors such as commodity prices, crop condition, currency exchange rates and worldwide demand for the grain crops produced in the U.S. The ideal scenario involves higher prices, a bumper crop, low U.S. dollar and high demand around the globe. The probability that will occur is extremely low but if any two of those factors begin to materialize, we could see a steepening hill before us and an elevated number of tractors sold in the U.S. next year.


Post a comment
Report Abusive Comment