Forecast vs. Actual
Our database for tractor retail sales and field inventory is derived from AEM’s monthly Flash Reports.
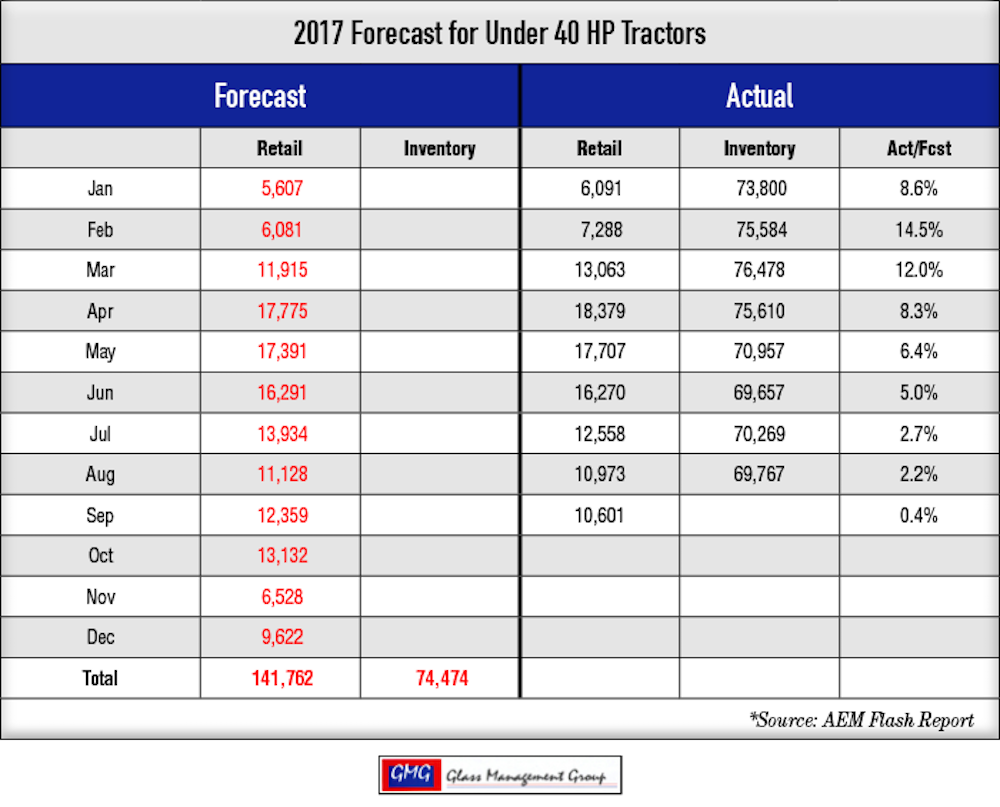
Under 40 Horsepower Tractors — These small tractor sales continue to remain strong and have moved even closer to our original forecast. The actual year-to-date retail sales vs. our original forecast currently stands at 0.4%. Since the general economy is major driver of sales in this category, the strength in this segment is likely to continue through 2018.
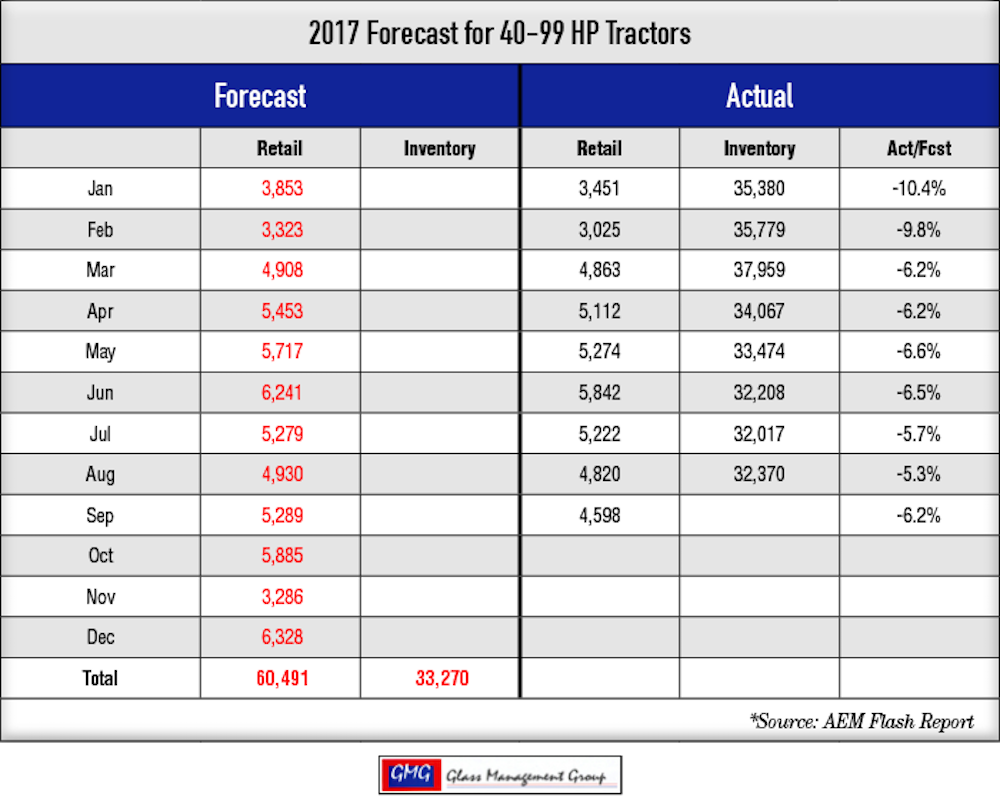
40 – 99 Horsepower Tractors — Retail sales typically reach their seasonal low in September and this month is following the pattern as this class of tractors moved back up 1% against our original forecast settling at –6.2% this month.
100 + Horsepower Tractors — Weak agricultural economic conditions continue to cast a shadow on this class of tractors as sales remained very weak in September. Actual retail sales were significantly below our original forecast and closed at –19.5% below the forecasted level.

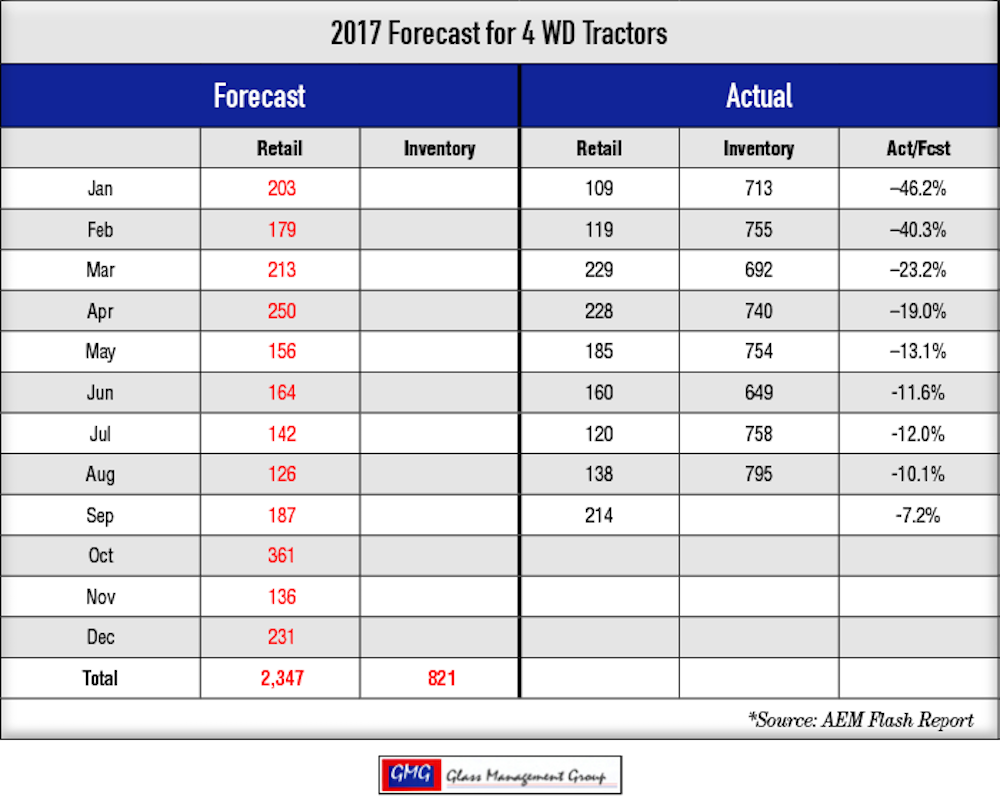
4 WD Tractors — These large tractors had a solid month for retail sales in September and inched closer to our original forecasted volumes. Actual retail vs. our forecast was –7.2% year-to-date.
Combines — Combine sales continue to suffer at the hands of low commodity prices as September closed. The year-to-date total actual retail sales vs. our original forecast rests at
–15.9%.

Farm Consolidation & Its Impact on Equipment Sales in 2018
Our database is derived from the USDA Agricultural Censuses dating back to 1982. The next census will be conducted in late December 2017 but that data will not be publicly available until mid-year 2018. In preparation for our 2018 Tractor & Combine Forecast we also produced a forecast for the number of farms and farmland in the U.S. One of our basic assumptions is that there is one primary decision-maker/buyer for each farm.
The number of U.S. farms has consistently ranged from 2.1-2.2 million farms since 1997. Our forecast suggests that the number of farms in 2017 will be slightly below at 2.065 million. Traditionally, the USDA Census classified farms by 7 acreage sizes that ranged from 1–9 acres up to 2,000 or more acres. The only growth in number of farms that our models are suggesting is in those two extremes with all of the intervening classes showing a decline.
While the total number of farms is declining, the average number of acres per farm is growing by approximately 1.8% with the forecasted average farm now covering 442 acres. The total numbers of farms that range in size from 50-1,999 acres represents 38% of all farms and are expected to decline by approximately 3% from the 2012 census level. These farms are significant purchasers of tractors larger than 60 horsepower and the decline in farms may already be apparent in the total tractor sales to date but this is a permanent decline.
The total number of farms that exceed 2,000 acres will grow by about 2,500 farms and that will result in a net loss of nearly 35,000 farms larger than 50 acres by 2017. It will reduce the number of potential purchasers of tractors larger than 60 horsepower by the same amount. That along with weaker commodity prices will put pressure on the larger tractor sales in 2018.
The Under 40 horsepower class of tractors and the lower end (40–60 HP) of the 40–99 horsepower category of tractors are not primarily affected by the U.S. agricultural economy, but respond to the changes in the overall economic conditions. Since January 2017, the U.S. economy has experienced positive growth with the general sentiment positive and those factors have provided fuel in the purchases of these smaller units. Growth in IRAs and 401Ks as the domestic stock market continues to rise has provided support for this improving sentiment and the economy and has allowed those owners to consider purchasing a news tractor for their lifestyle farms because of their new found confidence. The apparent growth in the small farm (1–9 acres) is indicative of new owners coming into the market and the potential for additional tractors to be purchased.
Our forecast estimates that the combined total of the two smaller farm classes (1–9 acres and 10-49 acres) will decline slightly in the 2017 USDA Census with the smallest class growing by approximately 1.2% while the 10–49 acre class declining by approximately 1.8%. These two classes could easily continue to support the current level of small tractor purchases in 2018.
Commodity Prices
Traders at the Chicago Board of Trade and other markets are closely watching the weather as harvest progresses. Hurricanes and the resultant rains that made their way into the grain producing belt could slow the harvest and could even reduce the total crop production.
Corn — Prices for these crops closed September slightly lower than in August with the December contract closing at $3.50 per bushel and the March contract closing at $3.63 per bushel. Weather concerns could help push these prices higher as the potential for a lower effective yield is on the horizon.
Soybeans — The November contract closed up by nearly 2.9% at $9.72 per bushel and the January contract closed up 2.9% over the August close and settled at $9.83 per bushel.
Conclusion
While there are many factors that determine the health of the tractor markets, the number of potential buyers is a critical factor that is often overlooked. Obviously, the rising level of commodity prices is the leading element for an increased net farm income and the resulting disposable income that farmers and ranchers have available for equipment purchases, but the reduced number of buyers is difficult to overcome. Granted the numbers are small, but they tend to have a cumulative effect over time and should be a part of any outlook of future sales.


Post a comment
Report Abusive Comment