Forecast vs. Actual
Our database for tractor retail sales and field inventory is derived from AEM’s monthly Flash Reports.
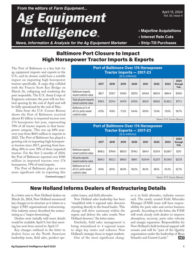
Under 40 Horsepower Tractors — Our year-to-date forecast through November totaled 132,140 units. The actual number retailed year-to-date is 133,755, resulting in actual being 1.2% more than forecast.

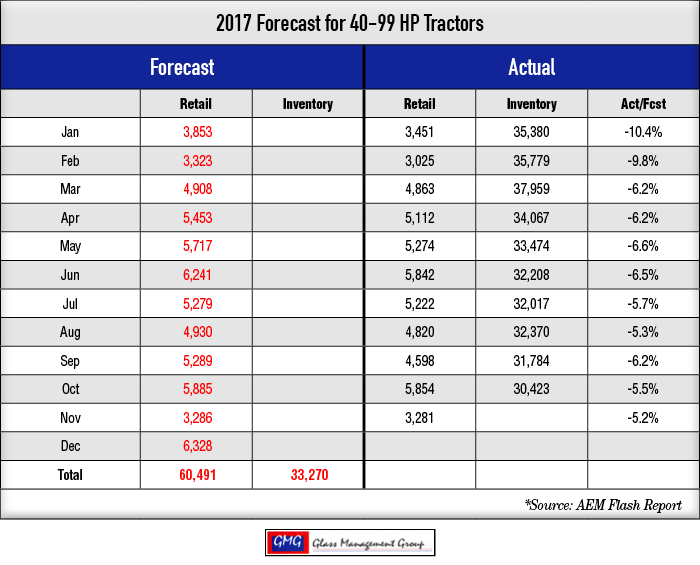
40 to 99 Horsepower Tractors — The year-to-date forecast for this tractor category totaled 54,163 units. The actual number retailed so far is 51,342. Through November, our projections are 5.2% higher than the actual.
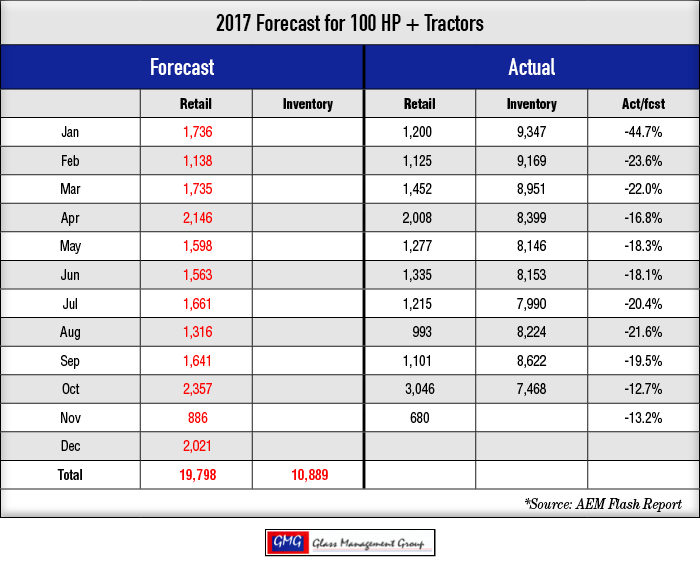
100 + Horsepower Tractors — The year-to-date forecast for the 100-plus horsepower tractor category is 17,777. The actual number retailed so far this year is 15,432, which puts out projections at 13.2% higher than the number retailed through November.
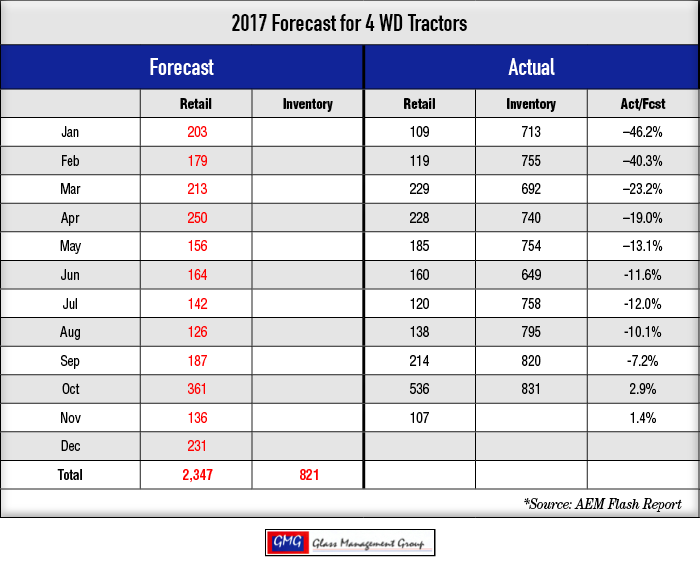
4 WD Tractors — Through the first 11 months of 2017, AEM reports that a total of 2,145 4WD units have been retailed. Our forecast called for 2,116 units sold through November, so our forecast was for 1.4% less than the number retailed.
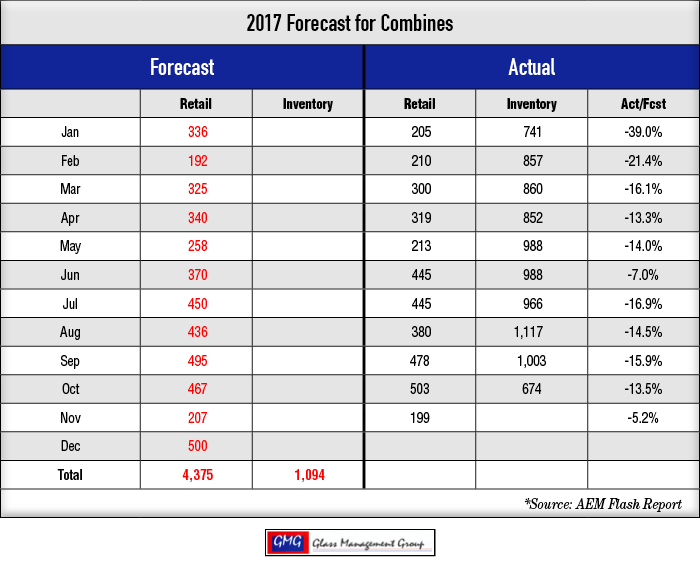
Combines – The year-to-date combine forecast totaled 3,875 units, while the actual number of combines retailed through November totaled 3,675 unit for a difference of –5.2%.
Successful Farming Requires a Positive Cashflow
On November 29, the U.S. Department of Agriculture (USDA) released their financial forecast for 2017 in their U.S. Farm Sector Financial Indictors and some interesting data emerged.
Total farm cash receipts are expected to reach $365.1 billion in 2017 and that represents a 2.7% increase over the 2016 level, slightly less than the 2.9% that our models suggested last month. A closer analysis of the underlying data reveals that revenues from all crops, of which corn, soybeans, wheat and cotton represent the bulk of the sales revenue, is projected to decline by 2% from the 2016 level.
This forecast also indicated that financial assets for U.S. farmers would increase to $80.2 billion which is 2.7% above the 2016 level, but remains the second lowest level since 2012. Farm debt is projected to rise to $385.2 billion which is 2.9% above the 2016 level. The debt-to-equity and the debt-to-asset ratios remain unchanged from the 2016 level at 14.5% and 12.7%, respectively.
Net cash farm income is projected to rise by 3.9% to $93.9 billion while net farm income reaches $63.2 billion, up 2.7%.
How does this affect 2018 retail sales?
Agricultural financial data for 2017 is certainly headed in the right direction, but is it enough to create a significant increase in demand for 2018? Grain farmers are the major purchasers of larger horsepower tractors and combines and with pressure on their income stream there is certainly an expectation that their purchases will not increase greatly next year.
Livestock producers expect to see an improvement in their income in 2017 with USDA’s projection of a 7.6% increase to $175.3 billion. Their increased tractor requirements will not offset the decline in demand from the grain farmers. As in prior years, there will be a need to replace tractors used on all farms and that demand will bolster the market until commodity prices begin to rise again and increased demand follows. While gross revenues are rising by around 3%, cash expenses required to produce crops is also expected to increase by nearly 2% in 2017, devouring approximately two thirds of that increase.
Our 2018 forecast indicated that the higher horsepower tractors and combines will remain under pressure for the coming year and the release of this financial data added credence to that forecast.
The bright spot in sales for 2018 remains the lower horsepower tractors. The demand for the less than 40 horsepower and for the 40–60 horsepower tractors will most likely continue to increase in 2018 as the general economy in the U.S. comes back to life after more than a decade of slumber.
Commodity Prices
Commodity prices continued to sink across the board in November even though 2017 is shaping up to be one of the better years for grain exports.
Corn — The December contract closed at $3.40 per bushel, down about $0.07 from the October close. The March contract closed at $3.52 per bushel and that was down about the same as the December contract.
Soybeans — The January contract closed at $9.91 and that was about 10 cents lower than the October close. The March contract closed at $10.03 and the May contract closed at $10.14.
Conclusion
Looking back, 2017 will most likely be viewed as the turning point in agricultural equipment sales for this cycle. While there will probably remain some weakness in the larger tractors and combines in 2018, there are definite signs of a bottom developing. Agricultural equipment sales have never been seen as a placid market but one that is historically marked with hills and valleys. The height of the hills and the depth of the valleys change over time, but our current situation is one of looking forward to a climb up the next hill.


Post a comment
Report Abusive Comment