Forecast vs. Actual
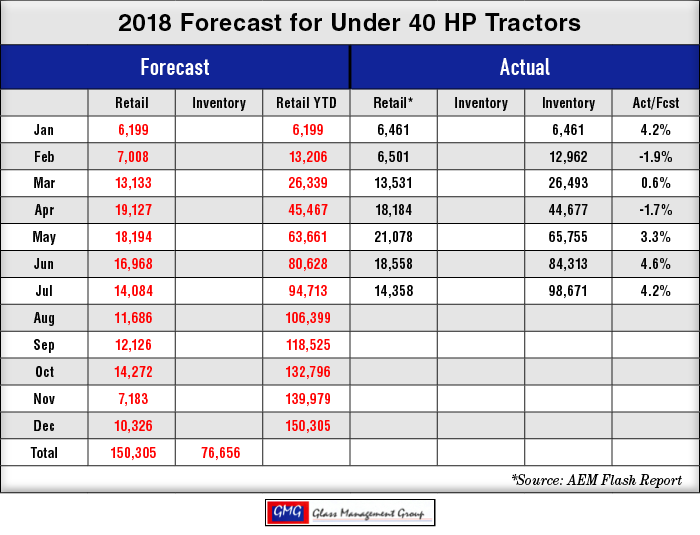
Our data base for tractor retail sales and field inventory is derived from AEM’s monthly Flash Reports.
Under 40 Horsepower Tractors — Actual retail sales for July were slightly more than our monthly forecast and the year-to-date numbers came within 4.4% of our YTD forecast.
40 to 99 Horsepower Tractors — This category of tractors came in about 330 units above our monthly forecast and the year-to-date totals were 4.8% above our YTD total forecast.

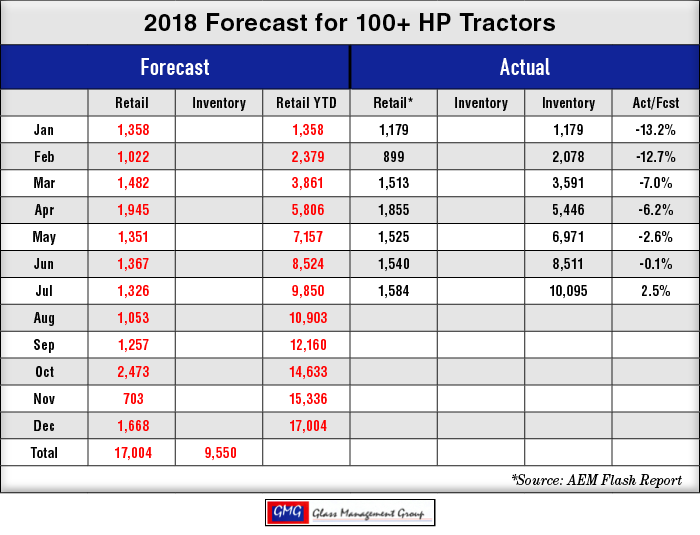
100 + Horsepower Tractors — This tractor group continued its 3 month run of exceeding our monthly forecast again in July and finished with year-to-date total sales of 2.4% above our YTD projections.
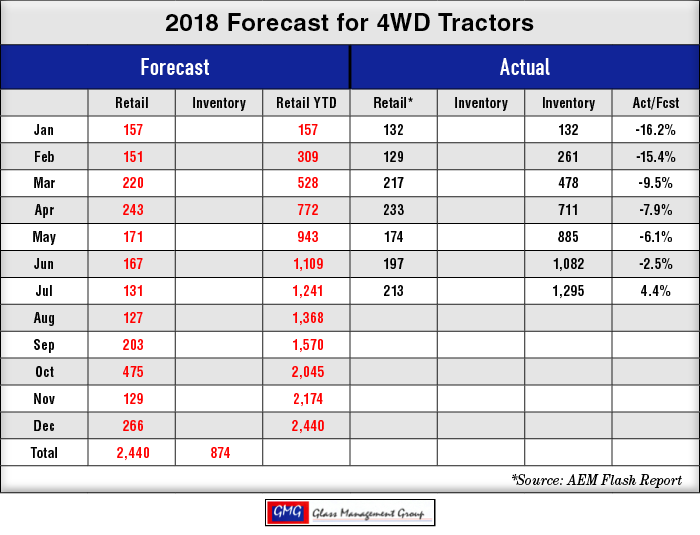
4 WD Tractors — This category began the year in a very weak position but has steadily gained to finish with a year-to-date number 4.4% above our YTD forecast.
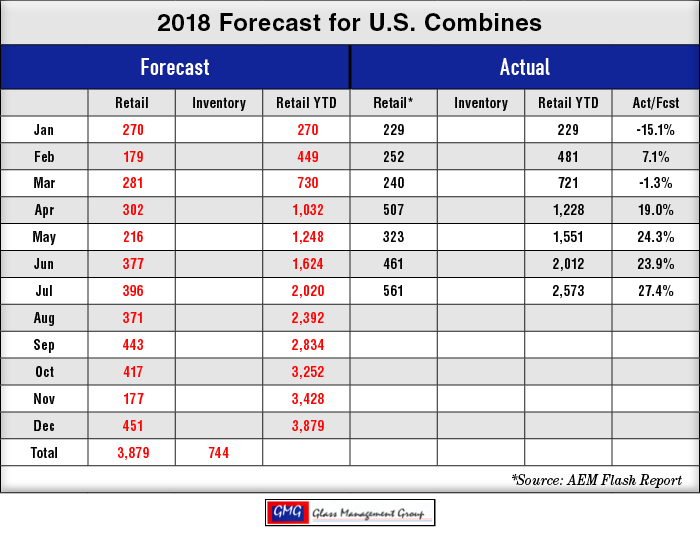
Combines — Combines have continued their steady increase in sales since April and finished the month at a whopping 27.4% above our YTD forecast.
Is There Light at the End of the Tariff Tunnel?
The struggle with China over tariffs is most visible for U.S. agricultural producers because they involve soybeans, grain sorghum and pork products which had previously comprised a major portion of our agricultural exports to China.
Based on recent discussions with the EU’s Jean-Claude Juncker in July, it does appear there is the willingness to discuss the removal of all tariffs and government support programs to make domestic products from both the U.S. and the EU more competitive on the world stage. One of the most highly touted announcements was the EU’s decision to increase their purchase of U.S. produced soybeans. This was easy to do since the EU had already become the largest purchaser of U.S. soybeans in June and were moving their purchases from Brazil due to the premiums placed on Brazilian soybeans.
China, on the other hand, is much more difficult since they seem unwilling at this time to have meaningful discussions on solving the Import/export problems. China’s economy is much more fragile than is the U.S. economy and the economic sanctions currently in place have shown the effects in China’s stock markets and their economy in general. If this stand-off continues China’s economy could feel the negative effects for some time in the future. China has reported annual GDP growth in the 6-7% range for several years but continue to fund government projects such as large apartment complexes in rural areas that currently are virtually vacant.
In 2017, the U.S. purchased nearly $392 billion worth of Chinese products and nearly half that amount was computers and electronics. Last year we sold China $15.3 billion in agricultural products, approximately 10% of the total U.S. purchases of Chinese computers and electronics. Any loss in U.S. sales would have an impact on the Chinese economy and would be difficult to replace from other nations around the world.
How Will This Effect 2018 Agricultural Equipment Sales?
With the U.S. general economy remaining strong, tractors under 60 horsepower have enjoyed brisk sales, along with the many implements that are used on those units. The Rural Mainstreet Index published by Creighton University continues to show strength even though their index has pulled back slightly from the June level.
Our models indicated that 2018 was going to be a year of base building in equipment sales and no significant changes have been indicated so far this year. Kansas City Federal Reserve Bank reported in their Ag Data Book for July that loan demand for equipment was down slightly during the month and the accompanying chart indicated loan demand had been flat for the past several months. Mid-summer is not a time for large volumes of tractor and equipment sales, but it does show that the trend toward base building continues for the year.
We currently have calculated the net farm income for 2018 to be about $59.5 billion and that is down nearly 6% from the 2017 levels. Historically, net farm income is a solid indicator for equipment sales for the following calendar year and appears to be pressuring our initial forecast of slight growth in 2019. Many of our other models continue to point to a growth of about 5.9% for all tractors and combines in 2019 with the under 40 horsepower tractors showing the most strength at about 8%.
The $12 billion Farmer Tariff Relief program will certainly add needed cashflow to those who elect to participate and should the entire amount be paid out this year, it would result in an increase of more than 6% over 2017 net farm income. Details of this program have not been released at month-end and those details will likely determine the rate of participation for affected farmers in the months to come.
Commodity Prices
July commodity prices recaptured about half of the June loss. While this movement upward did not put prices back to the May level, it did indicate some activity from buyers who increased their purchase volumes of U.S. produced grains.
Corn — Corn is still about $0.20 below the May levels but has picked up about half of the loss during July. The September 2018 contract closed at $3.72 per bushel while the December 2018 contract closed at $3.86 per bushel. The March 2019 contract closed in July at $3.97 per bushel.
Soybeans — The August 2018 contract closed at $9.03 and this was up from the June close by about $0.45 per bushel. The September 2018 contract closed at $9.08 and the November 2018 contract closed at $9.19 per bushel.
Conclusion
The uncertainty that accompanied the current tariff disputes has produced a black cloud over future tractor and equipment sales. In spite of those concerns we continue to see some strength in the larger tractor categories and in combines this year. Our database has continued to scream out that there is a base number of tractors and combines replaced each year and those replacement sales will most likely take place in spite of the lingering concerns about export activities. 2018 will most likely close with a flat to slightly higher gain in total units and the possibility of improving sales in 2019 beckons from beyond the horizon.
Steel and aluminum prices will most certainly result in an increase in all farm equipment prices next year, but our agricultural economy has been able to overcome those increases in the past and will most likely do so in the future.


![[Technology Corner] What an OEM Partnership Means to an Autonomy Startup](https://www.agequipmentintelligence.com/ext/resources/2024/09/26/What-an-OEM-Partnership-Means-to-an-Autonomy-Startup.png?height=290&t=1727457531&width=400)
Post a comment
Report Abusive Comment