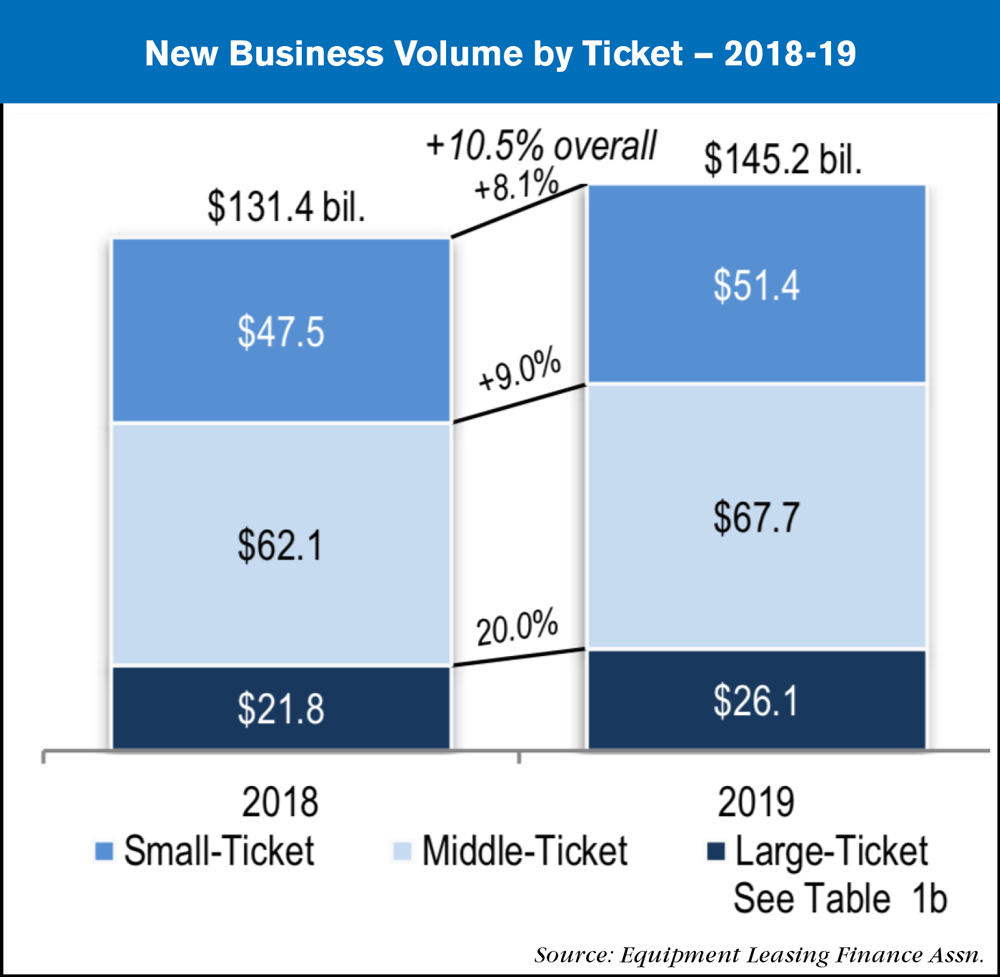
According to results from the Equipment Leasing and Finance Assn.'s 2020 Survey of Equipment Finance Activity, equipment finance companies charted a strong 10.5% overall increase in New Business Volume (NBV) for 2019. The rise was stronger than the 4.4% increase achieved in 2018 and very impressive when compared with growth of the nation’s GDP, reported at 2.3% for 2019 by the U.S. Department of Commerce. Results were compiled from 100 questionnaires.

End-user industries leading growth were Services (+$2.8 billion year-over-year), Agriculture (+$1.7 billion), Wholesale/Retail (+$1.4 billion) and Industrial / Manufacturing (+$1.5 billion) industries. The impact of the 2020 pandemic is expected to be significant on all of those end-user industries. Equipment types shepherding growth were Transportation (+$4.4 billion year-over-year), IT & Related Technology Services (+$1.9 billion) and Construction (+$1.6 billion).
Delinquencies, defined as receivables over 31 days past due, edged up in 2019 to 2.1% from 1.8% in 2018, and this deterioration was seen across the board. Net Full-Year Losses also edged up slightly overall, rising from a mere 0.24% in 2018 to 0.30% in 2019.
Key Findings by Sector:
-
Banks: A strong 12.8% increase grew Banks' NBV to $93 billion in 2019. This was much stronger than the 2.9% growth rate in 2018 and was the highest in five years. Trucks and trailers gave banks the most significant increase in dollar volume from 2018 to 2019, followed by construction. Bank delinquencies at 1.4% of receivables were an improvement over the overall rate of 2.1% of receivables over 31 days past due. Federal Government and Mining / Oil & Gas Extractions led past-dues by end-user industry categories, each with totals close to 5% delinquent.
-
Captives: With a 6.5% increase that brought NBV to $46.8 billion in 2019, Captives experienced growth in line with the 6.1% increase seen in 2018. Captives, due to their relationship with their parent and customers, traditionally support higher delinquencies than other equipment finance organizations. In 2019, 4.5% of Captives' receivables were 31 days or more past due compared to 2.1% overall. This is a slight increase for Captives from 4.2% in 2018. Although delinquencies were down, Mining / Oil & Gas Extraction led delinquencies by end-user industry, at 29% delinquent. Thankfully, this volume is just 1.6% of Captives' total NBV in 2019.
-
Independents: With an 8.4% increase that brought Independents' 2019 NBV to $5.9 billion, the growth rate for this smallest of sectors was greater than Captives' but lagged behind Banks' growth rates. Trucks and trailers held prime place in market share by equipment type in both 2018 and 2019. Construction equipment showed the highest dollar volume increase in 2019 for Independents compared to 2018. Independents' delinquencies increased from 1.9% to 2.7% of receivables in 2019. This is lower than the Captives' rate and greater than Banks'.
Overall Trends
The Large-Ticket segment commanded industry growth in 2019 with a 20.0% increase in NBV, though from the smallest base, to reach $26.1 billion in volume overall. The Middle-Ticket segment had the highest dollar increase in volume, growing by $5.6 billion to $67.7 billion; the Small-Ticket segment grew by $3.9 billion to $51.4 billion. Trucks & Trailers and Construction led the dollar volume growth by equipment type while Office Machines saw the sharpest drop in volume. Transportation, IT and Construction equipment dominated the equipment financing market.
The percentage of respondents whose NBV increased in 2019 rose to 69.7% overall, the highest rate since 2015. Independents won this contest with 85% reporting growth. Only 52% of Captives saw NBV growth in 2019.
In terms of new business volume, 31 participating companies reported doing over $1 billion in 2019, while 30 participants reported NBV of $250 million to $1 billion. Another 25 respondents reported doing $50 million to $250 million, while just 14 participants reported under $50 million in NBV.


Post a comment
Report Abusive Comment