The following report was published by FAPRI-MU. The authors are as follows: Pat Westhoff (westhoffp@missouri.edu), Seth Meyer (meyerse@missouri.edu), Julian Binfield (binfieldj@missouri.edu), and Scott Gerlt (gerlts@missouri.edu). The baseline projections used for this analysis were developed by the team at FAPRI-MU, including the contact authors, Jarrett Whistance (whistancejl@missouri.edu), Wyatt Thompson (thompsonw@missouri.edu), Sera Chiuchiarelli (chiuchiarellis@missouri.edu), Youngjune Kim (youngjunekim@missouri.edu), Hoa Hoang (hoangh@missouri.edu), Abigail Meffert (ajm35f@mail.missouri.edu) and Jong-Ik Kim (jkyd5@mail.missouri.edu), working together with colleagues at collaborating institutions.
COVID-19 represents an unprecedented situation both for the economy and the agricultural sector, and thus there is a limit to which prior experience can guide the current analysis. This analysis is both preliminary and highly uncertain given the constantly evolving market conditions. The analysis considers only some of the ways in which COVID-19 may affect markets and is based on a series of assumptions, many of which may be overtaken by events. The objective is not to provide definitive estimates of impacts, but to identify some key issues and help readers develop some notion of the rough magnitudes of possible effects.
Quantifying Impacts of COVID-19 Across Agriculture
A lot has happened since FAPRI prepared its outlook for the farm economy based on information available in January 2020. This analysis attempts to isolate COVID-19 impacts from other market changes that have occurred for unrelated reasons. We start from the version of the 2020 FAPRI outlook that assumes implementation of the Phase 1 trade agreement with China. We then change assumptions of that outlook to reflect some of the ways in which COVID-19 may be affecting agricultural markets, solve our system of deterministic models for the U.S. agricultural economy, and observe the resulting model estimates of changes in agricultural markets, farm income and government program outlays.
The table below shows assumed changes in key assumptions relative to the Phase 1 baseline. For example, the baseline assumed that real consumer expenditures would increase by 2.8% in 2020, based on forecasts available at that time from IHS Markit. In the scenario, we assume that real consumer expenditures will instead decline in 2020 by 2.2% relative to 2019, a difference of 5% from the baseline. In 2021, we assume that the economy recovers, so that real consumer expenditures are just 1% below baseline levels, and by 2021, real consumer expenditures and other variables are back at baseline levels.
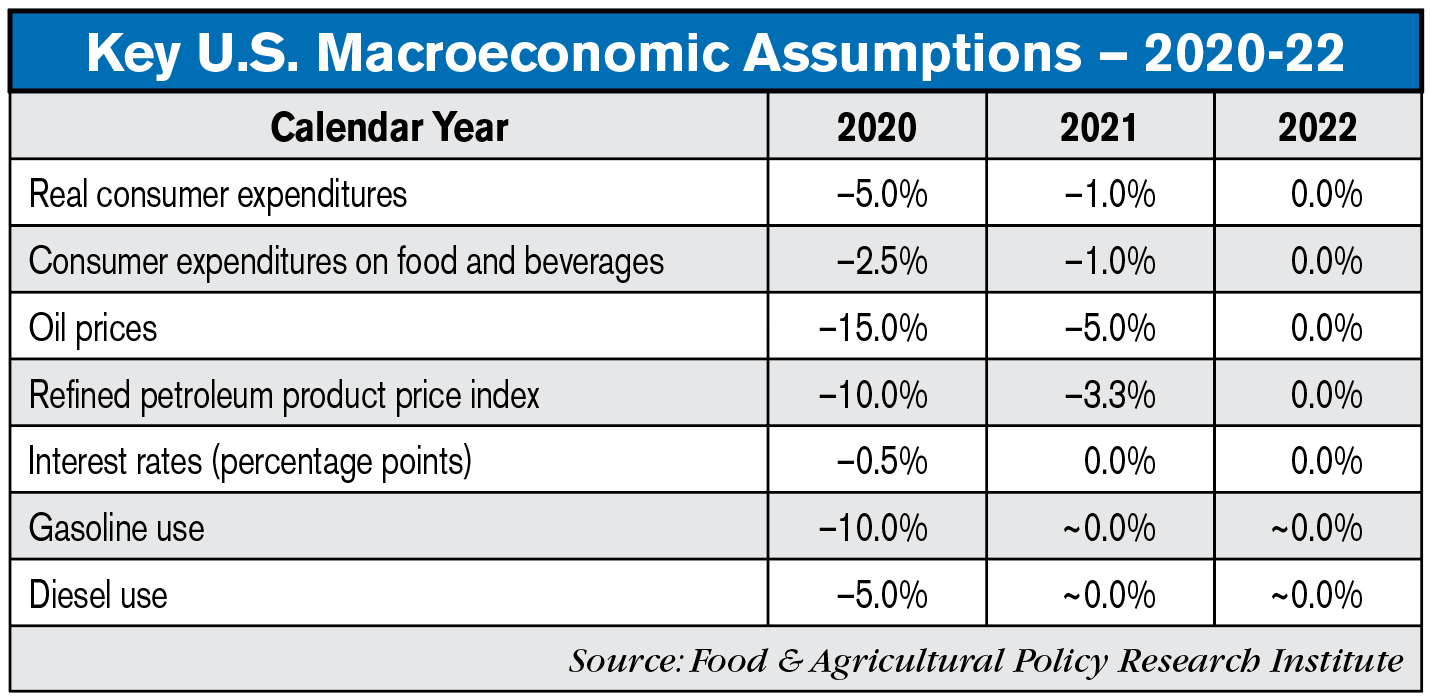
The eventual impact of COVID-19 on the economy depends critically on the length and intensity of the pandemic. The key macroeconomic assumptions made in this analysis represent a sharp and significant decline in the national economy in 2020, with the sharpest decline occurring in the second quarter. The scenario assumes a “V-shaped” recession where the market recovers quickly. Such an outcome is probably contingent on a rapid end to the public health crisis and to current restrictions on economic activity.
Oil prices are assumed to decline by 15% as a result of COVID-19. The actual decline in oil prices in March 2020 was much greater, but the analysis assumes that much of the observed decline can be explained by the dispute among oil producers that is not entirely attributable to the COVID crisis. Importantly for biofuels, both gasoline and diesel use are expected to contract. Early reports suggest a dramatic decline in fuel use as travel is restricted.
It should be noted that this analysis was conducted with FAPRI’s models of U.S. agricultural markets, not the full global system used to develop the January baseline. For purposes of this analysis, U.S. trade in most commodities is held at or near baseline levels, assuming the impacts of lower prices and a weaker global economy largely offset one another. As with supply chain issues, this is a strong assumption that should be revisited in future analysis.
Analysis
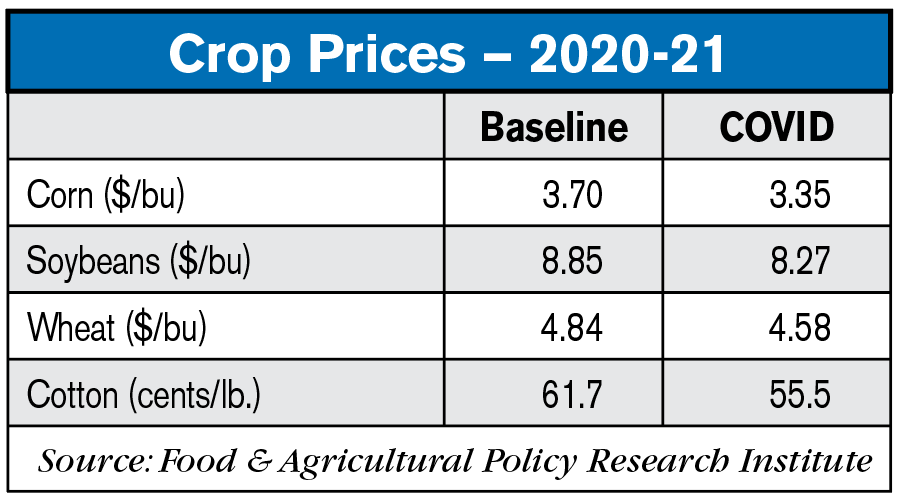
- The COVID scenario results in 5-10% reduction in crop prices in the 2020-21 marketing year and 8-12% reductions in livestock sector prices in 2020, relative to the Phase 1 baseline.
- With its bigger relative price change, corn area sees a modest decline. Cotton area holds, despite the large price decline, as government payments offset lost market revenue.

- Livestock, poultry and dairy producer prices all fall sharply in 2020 in response to weaker consumer demand caused by reduced disposable income.
- Supply chain concerns not considered in this analysis could put further downward pressure on producer-level prices for many commodities. In spite of lower fuel prices, farm-to-retail margins may increase for many food items.
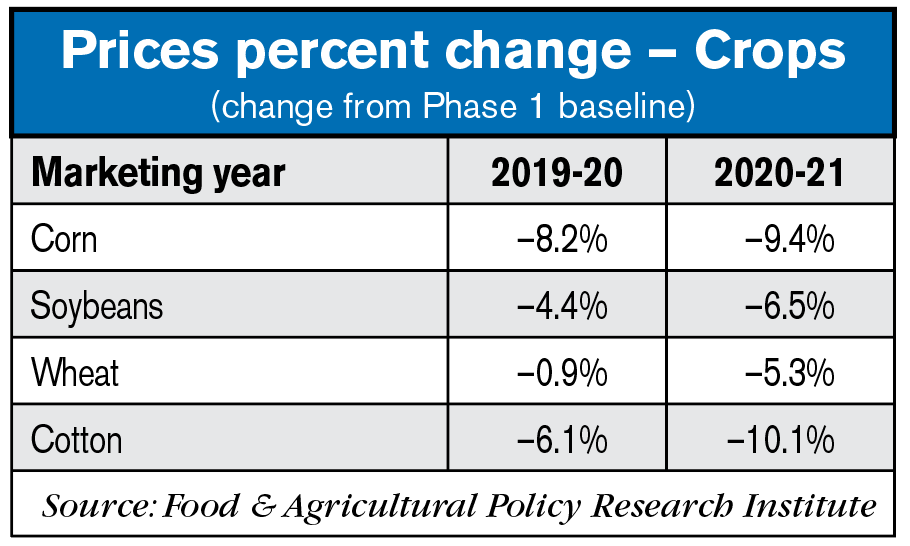
- Price impacts for crops tend to be larger in 2020-21 than in 2019-20, even though economic recovery is assumed to begin later this year. Most of 2020 crop production was not priced before the onset of the COVID-19 crisis.
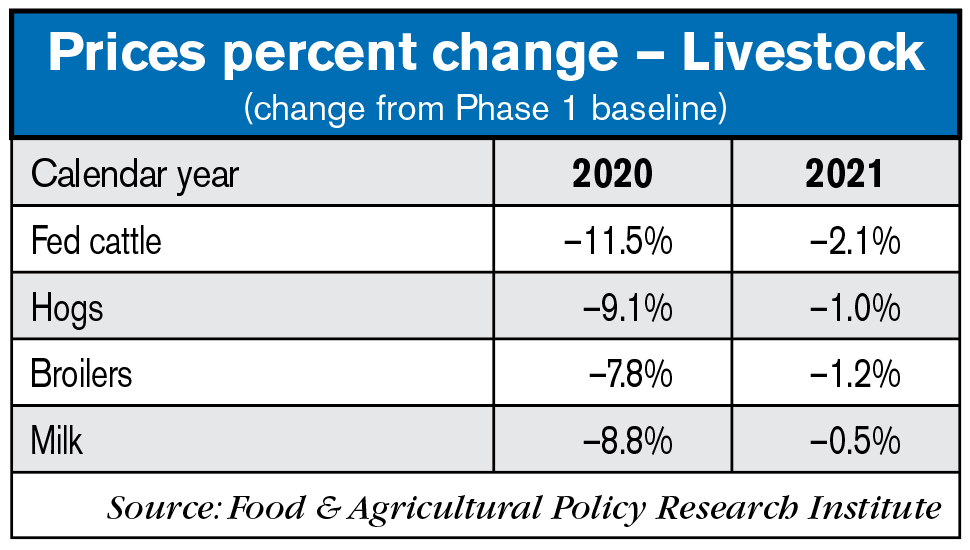
- Livestock changes moderate in 2021 under the assumed economic rebound.

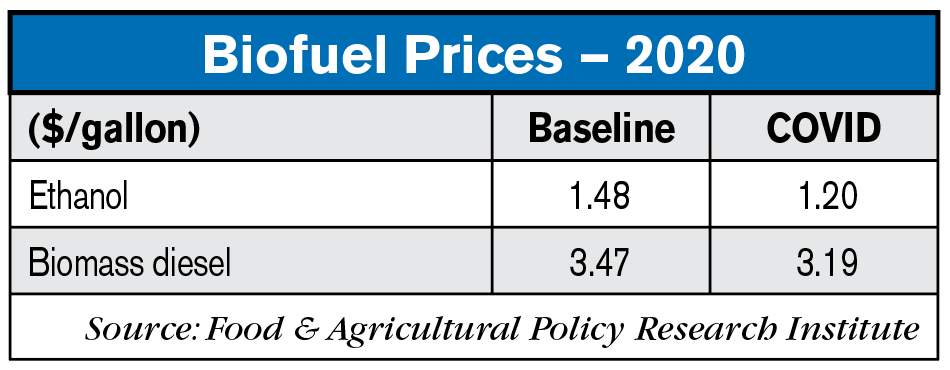
- Much of the reduction in corn prices can be explained by reduced production of ethanol. Implementing regulations by the Environmental Protection Agency convert mandated volumes under the renewable fuel standard into a percentage based on anticipated motorfuel and diesel demand prior to the start of the year. When gasoline and diesel fuel consumption falls unexpectedly, the mandated amounts of biofuel use decline accordingly. The rates at which biofuels are blended in the overall fuel supply is largely unchanged in the scenario.
- The reduction in biofuel demand results in lower prices, and plant operating margins turn negative, causing plants to stop or scale back production. Actual ethanol market prices in recent weeks have been substantially lower than the projected annual average.
- Ethanol production declines by 1.4 billion gallons relative to the baseline in 2020.

- Farm program outlays grow with declines in crop prices. ARC and PLC spending increases. In the case of cotton, prices fall low enough to trigger marketing loan benefits.
- Crop insurance outlays fall with lower commodity prices.
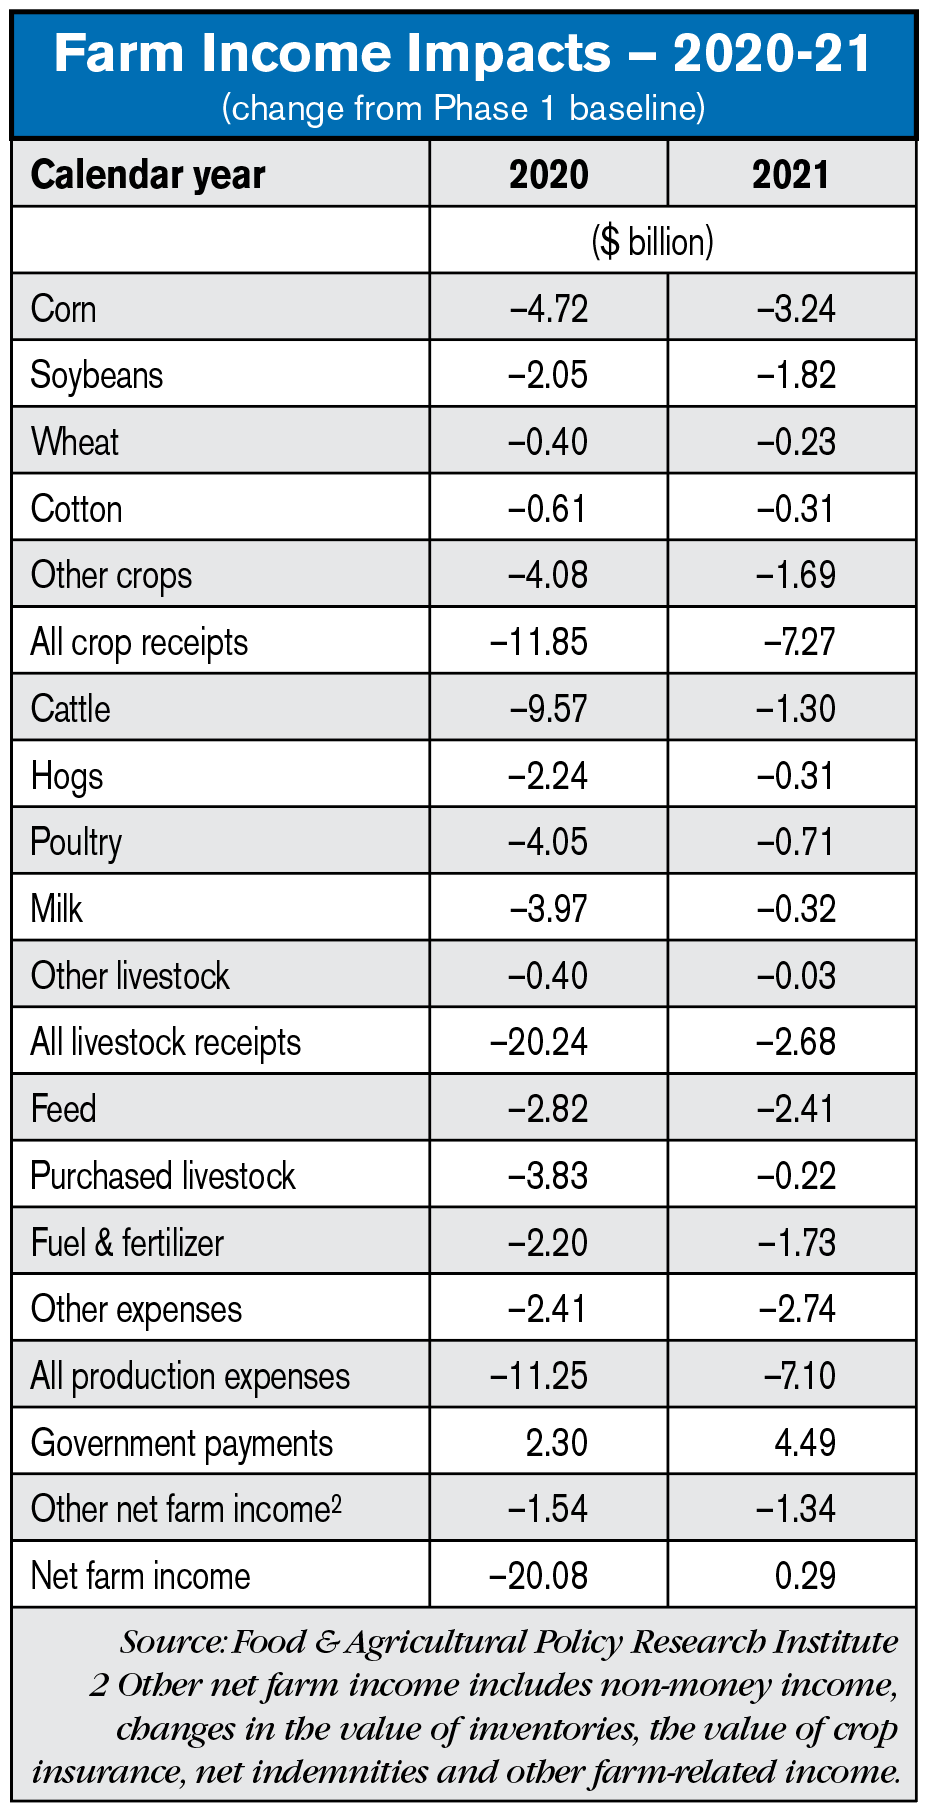
- Livestock receipts drop more than crop receipts in 2020, given the relative changes in market prices.
- In 2021, crop receipts are affected by the estimated changes in 2020-21 marketing year prices. Given model assumptions, livestock receipts rebound to closer to baseline levels in 2021.
- The reduction in receipts for livestock producers is partially offset by a decline in production expenses with lower purchased livestock, feed, fuel, interest, and other expenses.
- Also partially offsetting the drop in receipts is an increase in government payments.
- The reported reduction in receipts for “other crops” is partly attributed to an assumed reduction in the value of fruits, vegetables and nursery crops that are not modeled in detail.
- 2020 net farm income declines by about $20 billion.
- With an assumed economic rebound in 2021, farm income differs little from baseline values. Continued or extended COVID-19 impacts could increase or extend negative impacts on farm income.


![[Technology Corner] What are the Top 5 Applications in Autonomy Right Now?](https://www.agequipmentintelligence.com/ext/resources/2024/11/08/What-are-the-Top-5-Applications-in-Autonomy-Right-Now-.png?height=290&t=1731094940&width=400)
Post a comment
Report Abusive Comment