Earlier this month — Feb. 7 to be exact — USDA issued its farm sector profits forecast for 2018. The ag agency’s most recent outlook calls for further declines in net farm income and net cash farm income for the year ahead. But researchers at the University of Illinois Agricultural and Consumer Economics, say that, if past history holds true, the initial forecast is probably somewhat lower than what we’ll see next year at this time.
The 2018 Outlook
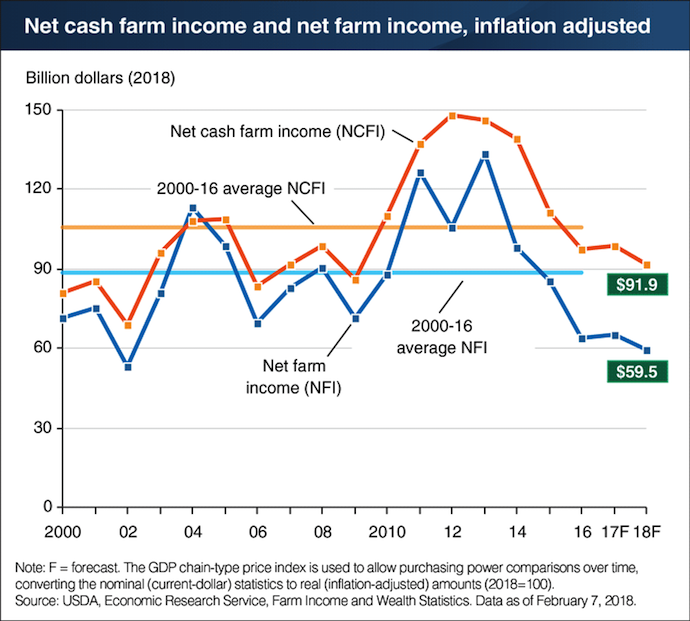
According to USDA’s initial preview, U.S. net farm income is forecast to decline $5.4 billion (8.3%) to $59.5 billion in 2018, while U.S. net cash farm income is forecast to decline $6.7 billion (6.8%) to $91.9 billion (adjusted for inflation).
“The forecast declines are the result of changes in cash receipts and production expenses. Additionally, government payments are forecast to decline $2.3 billion (20%) in inflation-adjusted terms; this is due largely to a forecast slight recovery in prices for many crops covered by the Price Loss Coverage program, combined with lower Agriculture Risk Coverage program revenue guarantees due to lower recent commodity prices for the crops covered under that program,” as reported in the Farm Sector Income and Finances report.
If realized, 2018 net farm income would be the lowest since 2002 and net cash farm income would be at its lowest level since 2009. Both profitability measures remain below their 2000-16 averages, which included substantial increases in crop and animal/animal product cash receipts from 2010-13.
Net cash farm income includes cash receipts from farming as well as farm-related income, including government payments, minus cash expenses. Net farm income is a more comprehensive measure of profits that incorporates noncash items, including changes in inventories, economic depreciation and gross imputed rental income.
Net Cash Income Forecast Analysis
Agricultural economist, Todd Kuethe of the University of Illinois at Urbana-Champaign, has studied the tendencies of the USDA forecasts previously [(August 25, 2017; August 31, 2017; November 29, 2017)]. His research has shown “that initial forecasts tend to under-predict realized net farm income, or in other words, the initial forecasts tend to be conservative. In addition, the analysis shows that ERS' net farm income forecasts tend to become more accurate during the forecast process, but the later forecasts often over-predict net farm income.”
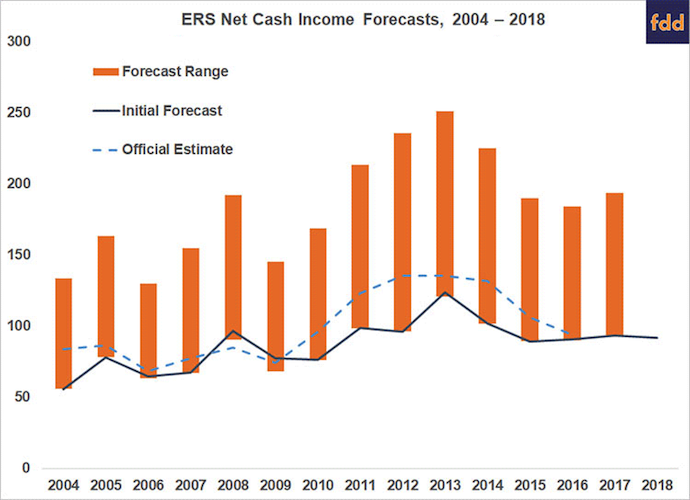
The bar chart below shows USDA’s Economic Research Service’s initial February forecast of net cash income since 2004, as wells as the current official estimates. “Over this period, ERS' initial forecast of net cash income was less than realized values for all but 2 years, 2008 and 2009. On average, the initial forecast was 12.6% below realized values,” says Kuethe.
Source: USDA ERS Outlook for U.S. Agricultural Trade, Feb. 22, 2018; Dept. of Agricultural and Consumer Economics, University of Illinois at Urbana-Champaign
The dark line in the chart plots ERS' initial February forecast of net cash income since 2004, and the blue dashed line represents the current official estimates of net cash income from 2004-16. The vertical orange bars show the range of forecasted values for each year.
The vertical orange bars in the chart show the range of forecasted values for each year. “The ranges show that ERS' forecast of net cash income vary throughout each, with an average range of $14.3 billion. The initial forecasts tend to be among the lowest forecasted values, yet the highest forecast values typically over-predict realized net cash income,” says the University of Illinois researcher. “Thus, we can expect ERS to revise late net cash income forecasts up, but these revisions will likely over-shoot realized values.”
He adds, “If the same pattern since 2004 holds, net cash income is likely to improve by approximately 12.6% to roughly $130.5 billion. This rough estimate is above the most recent official estimate of $94 billion in 2016 but well below the high cash incomes experienced between 2011-14.”


Post a comment
Report Abusive Comment