Focus on these 5 critical variables for even greater profits in the critical aftermarket departments — your dealership’s cash cow.
George Keen and George Russell Currie Management Consultants Worcester, Mass.
When famous bank robber Willie Sutton was asked why he robbed banks, he replied, “Because that’s where the money is.”
Sutton’s remark could also answer the question of why farm equipment dealerships should focus more attention on their parts and service (or aftermarket) departments. And after years of margin declines in wholegoods sales, dealers can aggressively increase the profits from their aftermarket sales — well beyond current levels.
This article presents planning and performance benchmarks for these aftermarket departments, which can help you plan aggressive but realistic targets for higher parts and service profits.
Measure It & It Will Move
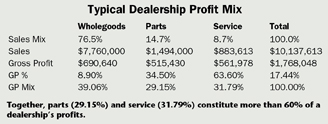
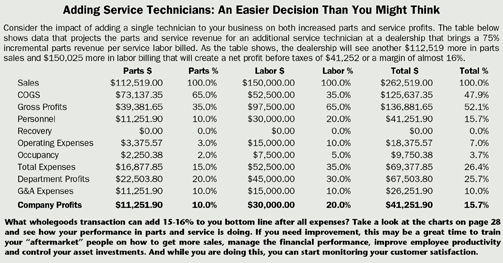
Of course, the wholegoods department creates the most sales revenue. But the table below shows the typical mix of profits (what the dealership gets to keep) that exists between wholegoods, parts and service.
When aftermarket departments (29.15% and 31.79% in parts and service profits, respectively) bring in more than 60% of the profits in a reasonably performing dealership, all dealer-principals should pay serious attention to maximizing their performance. And increasing their contribution level is not difficult with proper management and focus.
Assuming that a dealership already has inventory, technicians and support and counter staff in place, it all begins with organizing and setting reasonable goals for each department.
We follow a simple structure for designing targets and setting performance expectations. We call these the “Critical Department Variables.” These 5 factors are:
- Revenue/Market Share
- Financial Performance/Profits
- Employee Productivity
- Asset Management/Utilization
- Customer/Employee Satisfaction
Revenue/Market Share
Increasing the revenue of your parts and service departments is critical to long term health of your company. To accept the same as last year or less, means that with price increases, inflation and the cost of capital, you are going backwards. It’s easy to measure parts sales in dollars from one year to the next and see the difference. Service activity requires more thought.
One measurement to consider for service is “technician market share,” or the number of technicians in your dealership compared to those in all the other competitors in your area. As an example, if your dealership employs 9 technicians and the sum of all your local competitors is 57, your technician market share would be 16%. While a rough estimate, those other technicians aren’t likely to do far more work than your technicians, so the calculation is fairly accurate when using this simple method.
While it’s hard to measure other dealers’ parts volume in order to calculate parts market share, you can compare your sales dollars from year-to-year to ensure that you’re increasing parts sales.
Dealers should expect to grow 20% year over year in both the parts and service departments. For parts, that means 20% more in dollars of parts sales. For service, that not only means 20% more in dollars, but likely means that you need 20% more billable hours than last year, which could signal the need to add another technician — that is, if current technicians are fully productive.
Financial Performance/Profits
The second critical department variable is financial management and includes managing the gross profit percentage in each department as well as controlling the expenses. Standards of performance must be established for both departments.
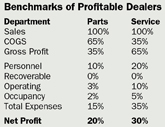
Our experience with hundreds of dealers over the years has identified some “best practices” benchmarks from dealers who are consistently profitable. The box at left shows the benchmarks for each department.
Note that 10% of the sales are reserved to cover (or absorb) the general and administrative costs of your dealership; so the net profit numbers expected in this model are not too high for good-performing dealers.
Managing profit margins is accomplished by controlling the cost of parts purchases, and recording all labor for service technicians. But a more important factor is to set, and hold, your revenue standards. Of course, you must be “competitive” on parts pricing, but usually this is a factor only for the major competitive items. There are always special and unique items that allow higher margins, thus providing the opportunity to price higher when parts are included on a service repair ticket.
In particular, you possess more control of labor and parts margins when you “quote” or “flat-rate” a repair job. The prices in the quote communicate the total value of your work — which should include your dealership warranty or how you back up your service. The customer wants the equipment working again with no downtime and with the confidence that the work will be done right the first time. If you live up to your word, such additional value-added service can bring higher margins for both parts and service.
A dealer in Georgia has a simple but effective “quoting method” that demonstrates value-added service. When a unit comes into the shop, a technician performs the diagnostic assessment. The dealer-principal then multiples the tech’s labor estimate by 1.3. So, a job that the technician believes will take 10 hours to complete will be flat-rate-billed at 13 hours (10 hours x 1.3). Adding the needed parts prices to the labor, he now has the total quote for the job. The customer is asked to approve the order before repairs begin.
Customers seldom object to their quotes, says the dealer. The dealership never bills more than the initial quote, except in very unusual cases. It has built in a cushion and is confident that it’ll be completed within the quoted amount. If the job takes less time, the dealership still bills the quoted price because that is what the customer agreed to. This approach ensures a higher standard for service profit.
When you use a quote-job or flat-rate system, it is also important to regularly review both individual and groups of jobs to ensure that you are achieving the expected profit margins on parts and labor over a broad range of jobs. From this, you learn to do better quoting and improve your turnaround to the customers.
Recoverable Expenses. The second part of managing your finances involves managing expenses, in particular two key items aid in expense recovery. In parts, the cost of freight in and out should be completely recovered from the customer. This is easily accomplished by telling the customer that on special-orders, an extra freight charge will occur and you can give him the option to decide how fast he needs the part. If the customer knows the costs up-front and makes a decision on that information, then there is no surprise when the part arrives and the freight cost is seen.
Another key recovery is with service vehicles and transport. While easy to calculate, most dealers do a poor job of recovering these expenses. If you have a transport vehicle, you should follow the same mindset as any local hauling company. You should track your expenses for the vehicle, including fuel, insurance, maintenance, depreciation, tires, windshields, taxes and tolls (which can be charged as a service call fee or zone charge). The objective is to recover the full cost of the vehicle (Note: the travel time of the technician is monitored separately under hourly productivity).
All the above costs should be recovered in your hauling or transport fees. If these costs are not being recovered, consider outsourcing your transport functions to a hauling company instead of doing it with your own equipment.
Employee Productivity
The third critical department variable in the aftermarket departments is employee productivity. For the parts department, the benchmark is to achieve $50,000 in parts revenue per parts employee per month (or $600,000 per year per employee). Included in the calculation are the parts manager, the counter staff, the shipping/receiving staff and any outside sales people that are charged against the parts department personnel expense. Of course, you need to look at balancing the staffing so that you have enough qualified staff to cover seasonal peaks such as planting and harvest.
In service, meanwhile, the productivity calculations are a balance between technician productivity, and the ratio between technicians and support or overhead staff.
The industry benchmark for service technician productivity is 85%, which means that the dealership should bill 85% of the labor hours it purchases from technicians. If a dealership pays technicians 40 hours a week for 52 weeks, this represents 2,080 labor hours per year that it “buys.” At 85% productivity, the dealership must bill 1,768 hours a year. If you bill $70/hour, this would mean that you need $10,000 per month per technician, and $12,500 if the billing rate is $85 per hour.
We recommend dealers follow a benchmark of 5 technicians for each overhead employee. At this level, you can afford good quality people and still stay within your 20% of revenue for the personnel expense.
Asset Management/Utilization
Because there are many more dollars committed to parts inventory than the parts work-in-process in service, the parts department must focus on managing the parts inventory. The benchmarks for parts inventory are at least 4 turns a year, with less than 5% of the inventory investment still on hand after 12 months.
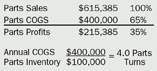
Calculation of inventory turns ratio is the annualized cost of goods for parts divided by the average parts inventory value.
Another “big picture” measurement for parts is “Gross Margin Return on Investment (or Inventory),” or GMROI. In the above illustration, multiply 35% time 4 turns and the result is a GMROI of 140%. Even if your parts margins are lower, say 28%, you can still achieve this 140% benchmark — if your turns are faster at 5.0. With lower margins, faster turns still allow you to achieve the same benchmark results for your dealership.
Customer & Employee Satisfaction
The fifth and final critical department variable is customer satisfaction. Some manufacturers measure this, but generally only for wholegoods equipment. You should be concerned about the end-user’s satisfaction with the entire dealership. Therefore, you should monitor or measure customer satisfaction in some fashion. This can be accomplished by a written survey, post-card reply, online Internet survey or phone calls. There are pros and cons to each, but the important thing is to implement some type of system and track improvements over time.
We expect dealers to collect enough responses in a given time period to be statistically significant, and to achieve a score that exceeds 90% satisfaction. You need to conduct more than one measurement, the first of which is merely the baseline. You need to then compare the next time period (month, quarter, etc.) to the baseline and see how you’re doing.
Within the comparisons, you want to study overall satisfaction and individual responses. If the overall score went up, also look to see which individual responses went up. If the overall results went down, determine which individual responses went down (such as individual responses to response time, price and value or employee knowledge). From the correlation of the individual responses to the overall improvement or reduction, you can identify what is causing the change and what you can address to make the change move in a positive direction.
Another factor to include when working to achieve customer satisfaction is employee satisfaction. Consider how customer satisfaction is impacted if a customer says to your parts counter person, “Your prices are always high!” and the parts counter person also feels underappreciated. A common response by counter people is to agree with the customer, instead of taking the opportunity to explain to the customer the stocking level that the dealership maintains for him, the knowledge of the dealership staff, the constant product training and the extended hours during the season. Identifying and maintaining employee satisfaction is critical to achieving customer satisfaction.
“Employee satisfaction” isn’t about Friday night happy hour, or bowling or pizza parties. What we mean is:
- Do they know their job expectations?
- Do they know how they’re performing against those expectations?
- Do they get recognized when they achieve expectations?
- Do they get training and coaching so that they can do better?
From considerable research, we know that employees are more concerned about being appreciated and having clear, objective and consistent goals than when pay raises will occur.
Employees that are a) paid in line with local competition, b) have clear, objective expectations and c) receive regular feedback on their performance will be more “satisfied” and better informed than employees with high pay and no clear expectations. Management makes more of a difference than the paycheck.
Currie Management Consultants hosts Service Management Seminars for dealerships and has also published a book, The Service Workbook: Achieving Profit Potential in the New Millennium. For more information, visit www.curriemanagement.com.
Click here to view the Dealership Financial Model Analysis.

Post a comment
Report Abusive Comment