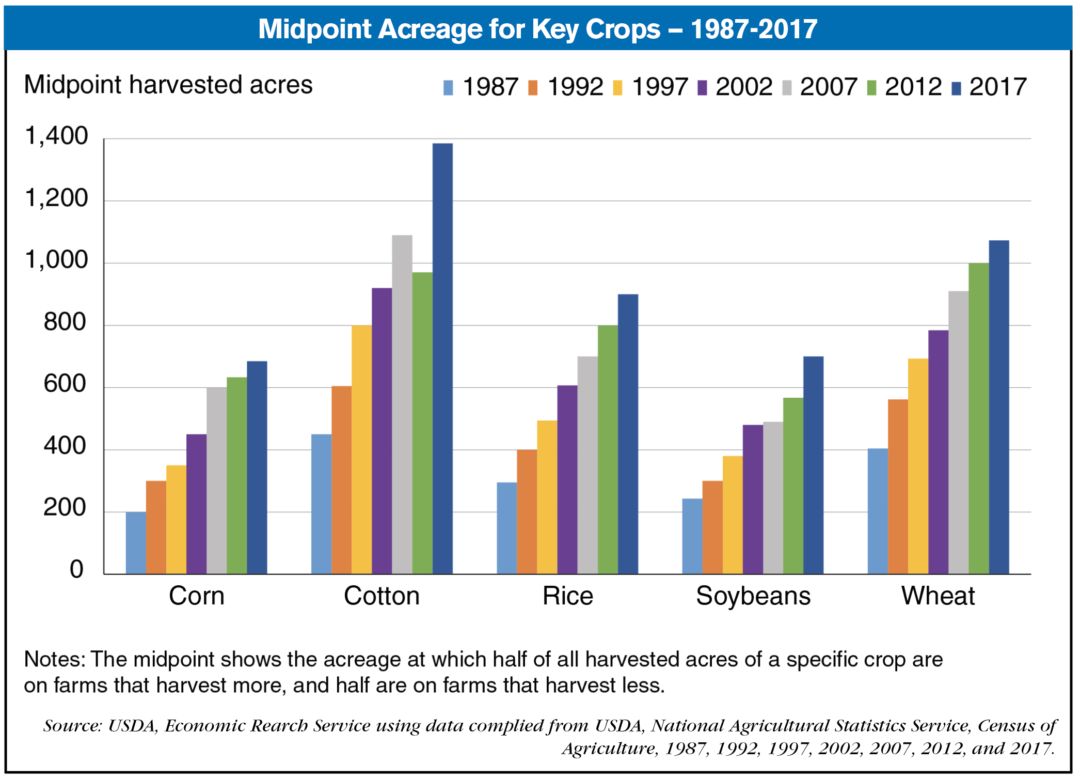
Over the past three decades, the midpoint acreage—where half of the acres of a specific crop are on farms that harvest more than the midpoint, and half are on farms that harvest less—has shifted to larger farms for almost all crops. In 1987, for example, the midpoint acreage for corn was 200 acres; it increased to 685 acres by 2017. Four other major field crops (cotton, rice, soybeans, and wheat) showed a very similar pattern: the midpoint for harvested acreage increased between 1987 and 2017 by amounts ranging from 166% to 243%.
The midpoints also increased persistently in each census year, with the single exception of a decline in cotton from 2007 to 2012. Economic Research Service researchers extended the analysis to 10 more field crops and to 40 fruit, tree nut, berry, vegetable, and melon crops. Consolidation was nearly ubiquitous, as the 2017 midpoint acreage exceeded its 1987 level for 53 of 55 crops (the exceptions were lemons and plums/prunes). Consolidation was also substantial — the average 1987-2017 midpoint increase across the 55 crops was 148%, and 44 of 55 crops showed at least a 100% increase. Finally, consolidation was persistent over time, with continued midpoint increases for 42 crops between 2012 and 2017.
This chart appears in the February 2020 Amber Waves feature, “Consolidation in U.S. Agriculture Continues.”


Post a comment
Report Abusive Comment