Forecast vs. Actual
Our database for tractor retail sales and field inventory is derived from AEM’s monthly Flash Reports.
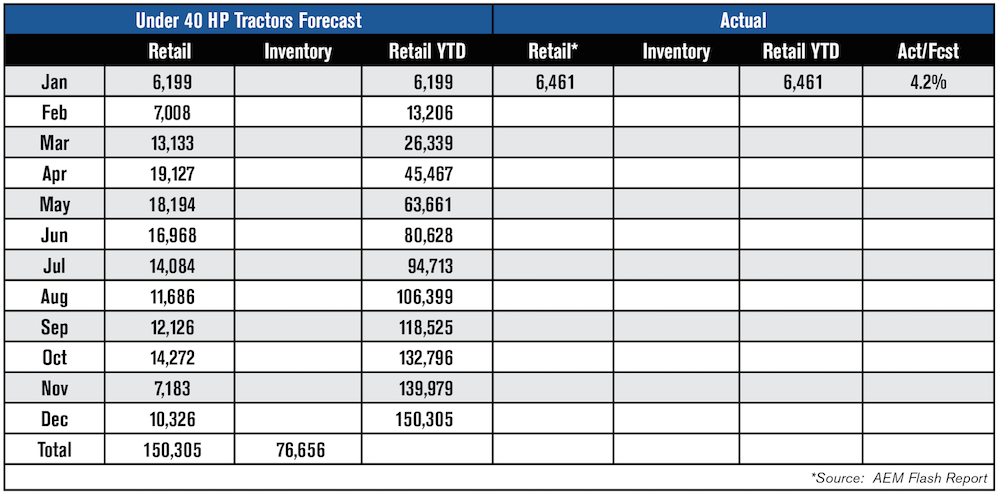
Under 40 Horsepower Tractors — This category retail sale numbers came in slightly higher than our monthly forecast by 4.2%. The annual forecast remains within range of our original forecast.
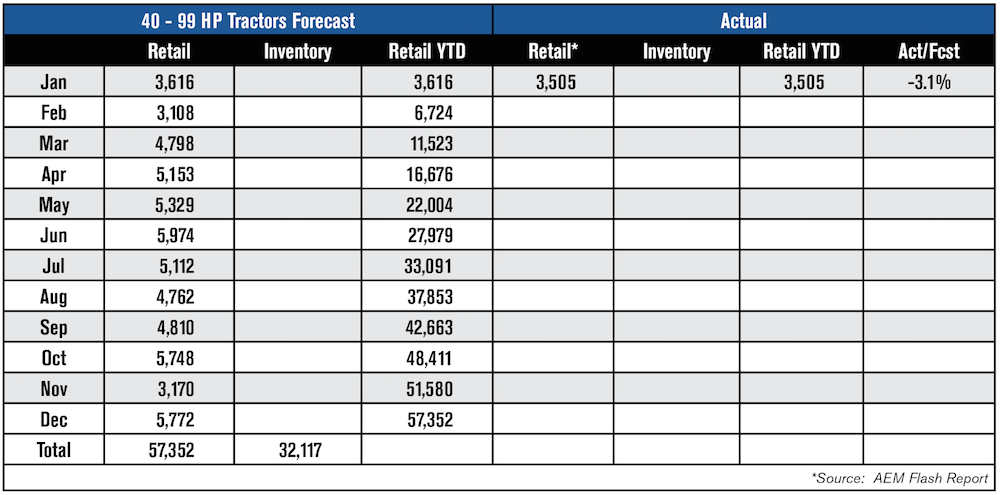
40 to 99 Horsepower Tractors — The lower third of this horsepower range remains strong with weakness evident in the higher ranges. This will probably continue to 2018, but we expect the year-end totals to reach our original forecast.
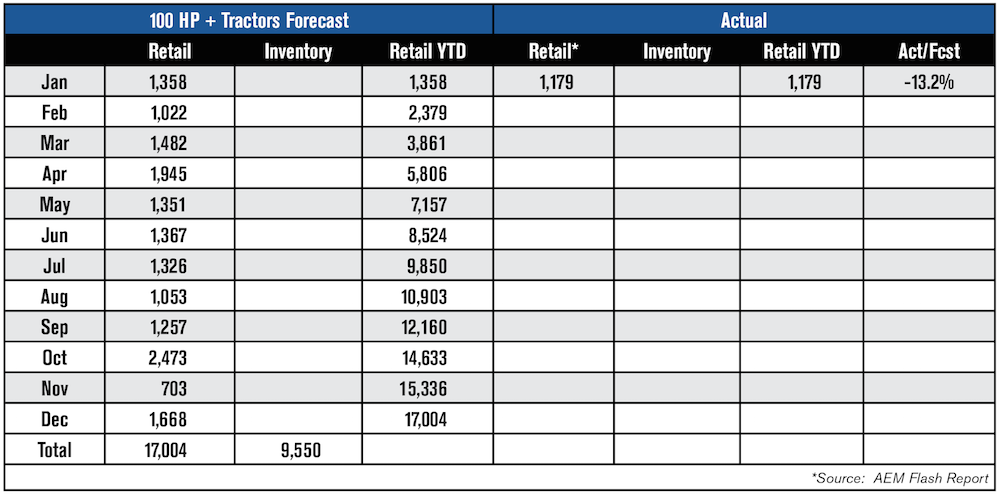
100+ Horsepower Tractors — This month’s retail sales were 13.2% below our monthly forecast and may be indicative of additional weakness within this category.
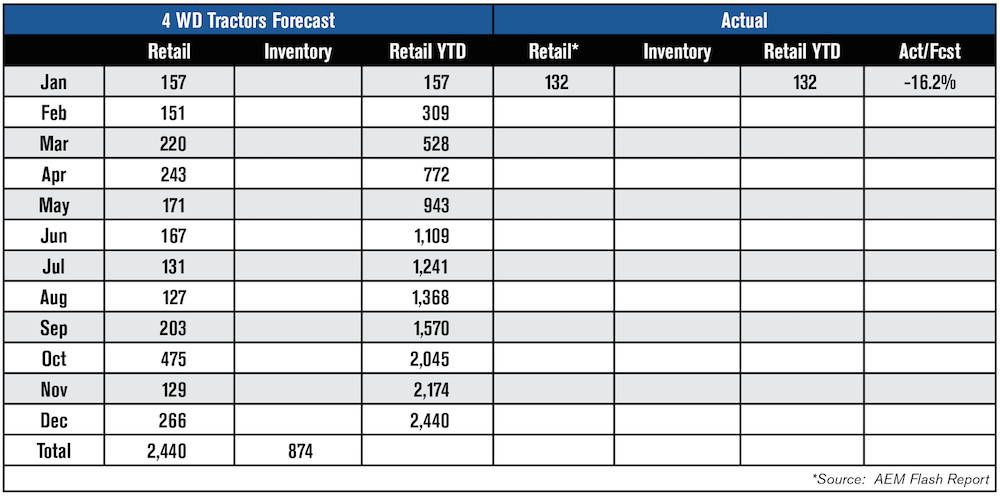
4 WD Tractors — These largest tractors had retail sales that were 16.2% below our monthly forecast but we continue to believe this category will reach our original forecast by year-end.
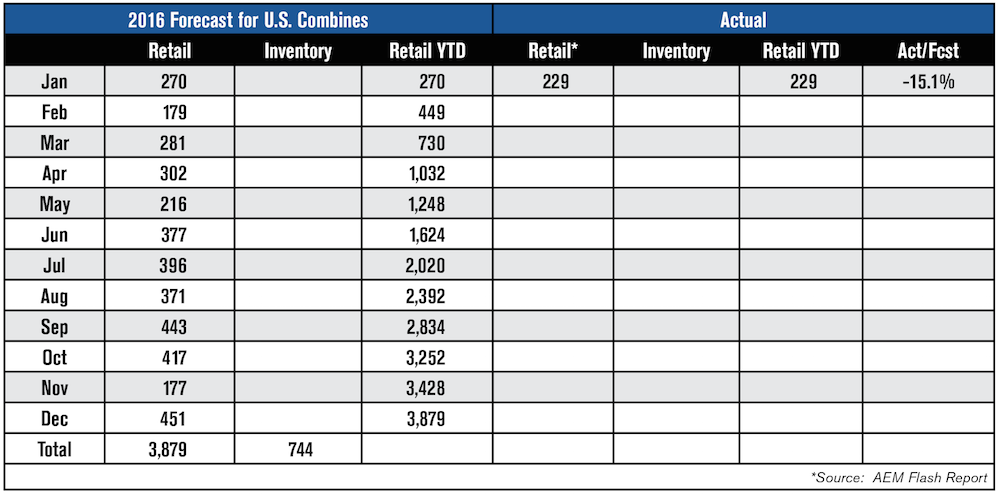
Combines — Our original forecast for combines in 2018 was down from the total sold in 2017 and January retail sales continue to show the impact of the weak agricultural economy. Combine sales for January were 15.1% below our monthly forecast but will most likely finish the year near our November forecast.
Commodity Prices Equals Cashflow
There are many models that we employ in developing our annual forecasts each November and the models that have the greatest impact are usually those that predict net farm income and net cash farm income. The trend of these two income models will provide much insight into the strength of the equipment sales for the coming year. U.S. farmers and ranchers tend to be rather conservative business people and the strength of their assets is a major factor in their buying decisions each year.
Grain producers typically purchase the majority of the higher horsepower tractors and combines. Consequently, the price level for commodities, primarily corn, soybeans and wheat, will determine the strength of this group’s bank account come harvest time and their willingness to part with those funds to acquire new equipment.
Commodity prices, particularly corn, at the current levels are only marginally profitable for many U.S. farmers. We do not possess a crystal ball that will tell us the price level for corn next December, but a close review of the data related to corn will reveals much information.
Past Corn Production Levels: In 2017, U.S. farmers planted a total of 90.2 million acres of corn and that was down (4.3%) from the previous year while harvesting 82.7 million acres. Corn yield per acre has been on a relentless climb since 1987 and 2017 yields reached a record 176.6 bushels per acre, even though total production is down 3% from the 2016 levels, according to USDA.
Corn Stocks: Corn stock levels have increased each year since the 2012-13 marketing year and the December 2017 balance reached 16.9 billion bushels for the 2016-17 market year. These stocks include the crop remaining unsold on the farm while the farmer is waiting for a better pricing opportunity to sell their remaining corn. This large inventory will have a negative effect upon 2018 prices.
Export Sales Activities: The U.S. has been a major seller of corn and other commodities to the world for the past 50 years. In the late 1970s U.S. export sales of agricultural commodities represented slightly more than 70% of all commodities sold internationally. It was this strength that helped President Jimmy Carter to make the decision to halt commodity sales to Russia in the early 1980s. Since that time the U.S. share of commodity sales has declined and now rests at approximately 22% of the total international sales. In the past several years the percentage of the U.S. crop sold on the export market has risen from around 30% of the total crop to approximately 40% in 2016.
How Does This Affect Equipment Sales in 2018?
Weakness in corn prices will most certainly affect both income models for 2018 and, since the majority of large tractors and combines are purchased by grain farmers, a reduced pool of assets with which to purchase new equipment will continue to apply downward pressure on those sales.
The U.S. tractor market is clearly divided into the “small tractor market” and the “large tractor market.” While the agricultural economy will dictate the movement in the larger tractors, the smaller tractor markets march to a different drummer, the general U.S. economy. The general economy of the U.S. continues to gain momentum each month in 2018 and there is a growing confidence among consumers throughout the country. That confidence will continue to propel the smaller tractor sales in 2018.
Commodity Prices
One of the major tractor manufacturers recently announced in their quarterly earnings report that “$3.50 corn and $10 soybeans will be the new normal.” While soybeans continue to be a profitable crop for U.S. farmers, corn is teetering on the edge of profitability. There are strong indications that farmers are considering reducing corn acreage and increasing soybean acres planted in 2018 in order to improve their overall cashflow situation.
Corn — The March corn contract closed the month at $3.61 per bushel and the May contract closed at $3.69 per bushel. Both were slightly higher than the December close.
Soybeans — The May contract closed at $9.96 and that was slightly higher than the December close. The May soybean contract closed at $10.07 and the July contract closed at $10.16 per bushel while both showed positive movement over the December close.
Conclusion
While there are a base number of tractors and combines that must be replaced each year, the strength of the yearly sales is dependent upon those tractor purchases above and beyond the replacement numbers. With the U.S. general economy continuing to grow each month, there is a glimmer of hope on the horizon for agricultural sales. Historically, the agricultural economy trails the general economy by about 18 months and that bodes well for 2020 and beyond. The year ahead, 2018, could be another difficult year for larger tractor and combine sales with total numbers hovering around the 2017 totals.